1.The Joy of Stats with Hans Rosling
Rosling is a classic, as is this video. From BBC Four: Hans Rosling’s 200 Countries, 200 Years, 4 Minutes – The Joy of Stats. This is just a slice of the the full one hour documentary available via BBC Four.
2. Inventing Abstraction 1910-1925
This exciting interactive visualization arrives from the Museum of Modern Art. It shows, explores and explains the networked flows of interactions and thought exchanges that lay beneath and within the Abstraction movement. As the site over declares: “Abstraction was not the inspiration of a solitary genius but the product of network thinking–of dieas moving through a nexus of artists and intellectuals working in different mediums and in far-flung places.” 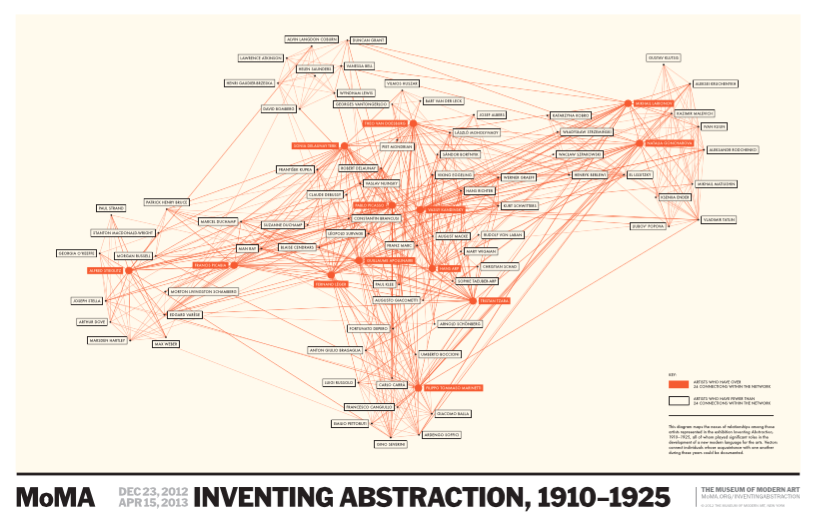
3. Pop Chart Lab
“A book editor and a graphic designer joined forces with one modest goal: to render all of human experience in chart form.” Prints, housewares, stationary, a graphic plotting of all known fiction genres, a visual compendium of sneakers… 4. Dear Data
This is amazing. Follow a year-long drawing project by data visualizers Giorgia Lupi and Stefanie Posavec. Each Wednesday the pair exchange a postcard with hand-crafted illustrated data visualizations, using data collected from their own lives. “Two girls who switched continents get to know each other through the data they draw and send across the pond.”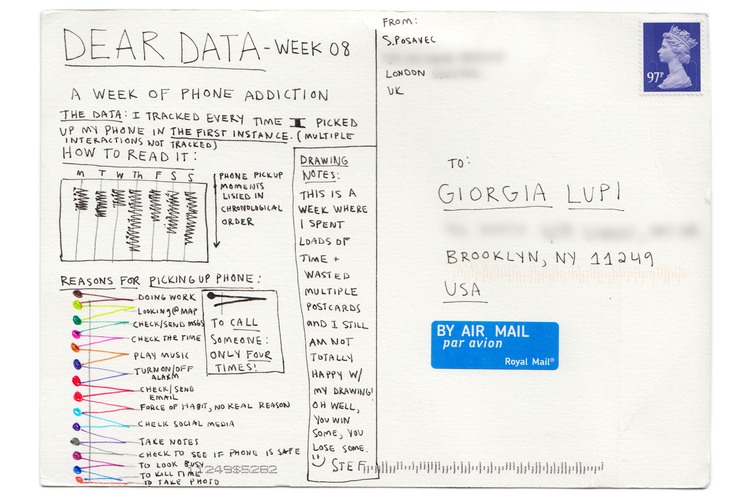
5. Fort McMoney
“Where film marries video game.” Fort McMoney is a web documentary and strategy video game about Fort McMurray and Canada’s tar sands. Directed by David Dufresne, produced with the NFB.